
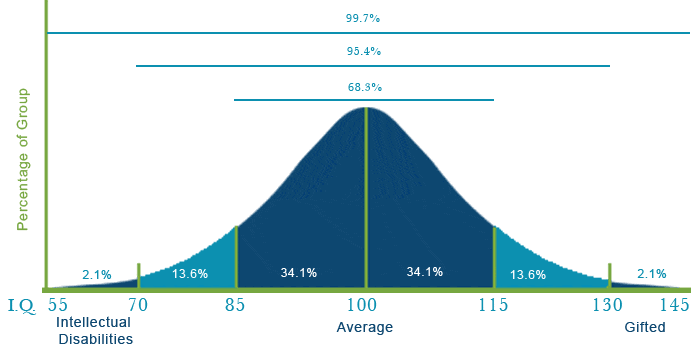
In the state of Florida, IQ is one of several criteria used to determine eligibility. The IQ criterion for gifted eligibility is two standard deviations (30 points) above the mean, or 130 IQ on a standardized individual test of intelligence. You can see from the diagram below that statistically we can predict that 2.1% of the students tested will score at or above 130 on the test. A closer look at the 2.1% is where we find that they are mostly white, mostly from middle/upper socioeconomic status families. The ELL student is not anywhere on the plot since the tests are not normed for languages other than English. The opposite is true on the other side of the mean of 100. Here we find mostly minority and Lower SES families. With this knowledge, you must make a decision. Do you believe that standardized IQ tests capture the true construct of intelligence? Do you believe that Lower SES students and minorities are born less bright than their white middle/upper class peers?
The test bias debate goes on. However, the real key is to recognize that standardized tests are not infallible measures of gifted potential. Tests just don’t provide all the information needed to make decisions about gifted potential for exceptional performance.
Teachers are in the best position to provide significant information about students that is not available through tests. That is the very reason that procedures used to identify gifted students have changed from a focus on a single intelligence test score to the current focus on multiple methods and instruments. Prior to the 1950s, identification of gifted children was based almost totally on test scores. By 1985, 32 states used a variety of procedures and instruments, but still included IQ and achievement testing. Required cutoff scores on IQ tests ranged from 120 to two standard deviations above the mean (130). Procedures other than IQ tests include both qualitative and quantitative instruments, rating scales, checklists, critical thinking tests, creativity tests, achievement tests, self-concept inventories, and product samples.
All states use some form of intelligence and achievement test results in the identification process. Responding to the historic underrepresentation of special populations of gifted being identified, 40 states use different criteria to identify them today. Florida uses Plan B to address this underrepresentation which will be covered in greater detail later in Week 3.
In the article Research Review: Finding Underserved Populations, authors Daniel Resnick and Madeline Goodman write how traditional methods of identifying gifted students do not necessarily work for these underrepresented groups of students. As you read this research review from Northwest Education magazine, pay close attention to guidelines for finding and serving African American students. Think about how these guidelines can be applied to other underrepresented groups, too.
Summary
The debate over whether standardized IQ and achievement tests are biased will most likely rage on within the psychological and educational communities. More important than whether they are or are not biased are the facts that:
- Some students do not do well on tests yet their everyday work shows significant understanding and achievement.
- A standardized IQ test may not be the best predictor of who our gifted students will be in our ever-changing society.
- IQ tests clearly miss those students who are limited English Language Learners, but still may be gifted, and recognized as such in their culture.
- IQ test results have been unsuccessful at identifying students from low socioeconomic families, and students from minority cultures and backgrounds.
It’s imperative that we look beyond standardized testing to search for our special populations of gifted students.
In-Depth Required Reading
For this week, read Research Review: Finding Underserved Populations by Daniel Resnick and Madeline Goodman.